YouDubber - Download video |
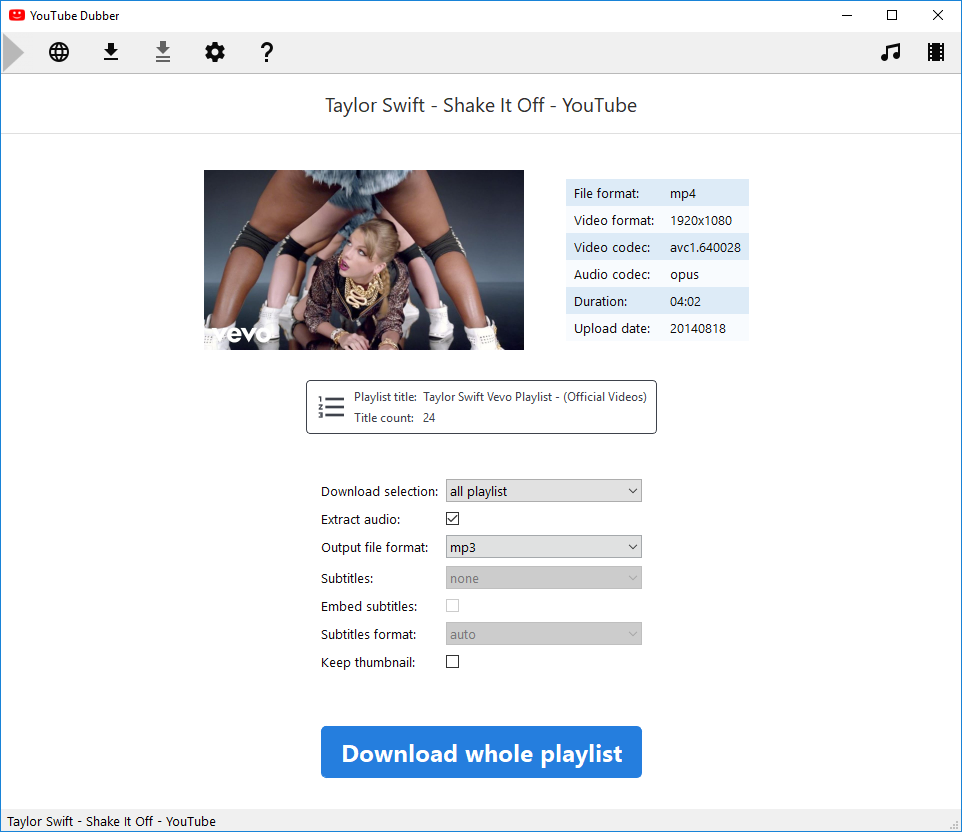
YouDubber download videos from YouTube and Adult Rated websites (24.99€).
 The PREMIUM version is FREE for summer kick-off. Enjoy full version! The PREMIUM version is FREE for summer kick-off. Enjoy full version!
- Navigate and download from YouTube and popular video websites
- 1-click check video before downloading
- Complete download options:
- title or playlist selection
- audio extraction (mp3/m4a/aac/opus/wav)
- video format (mkv, mp4, webm, avi, flv)
- subtitles/closed-captions selection
- embed thumbnail and ID3 tags
- Download videos from Adult-Rated websistes (including PornHub Premium)
- Downloader engine auto-update daily
|
Blu-ray and DVD copy - Video transcoding and editing |
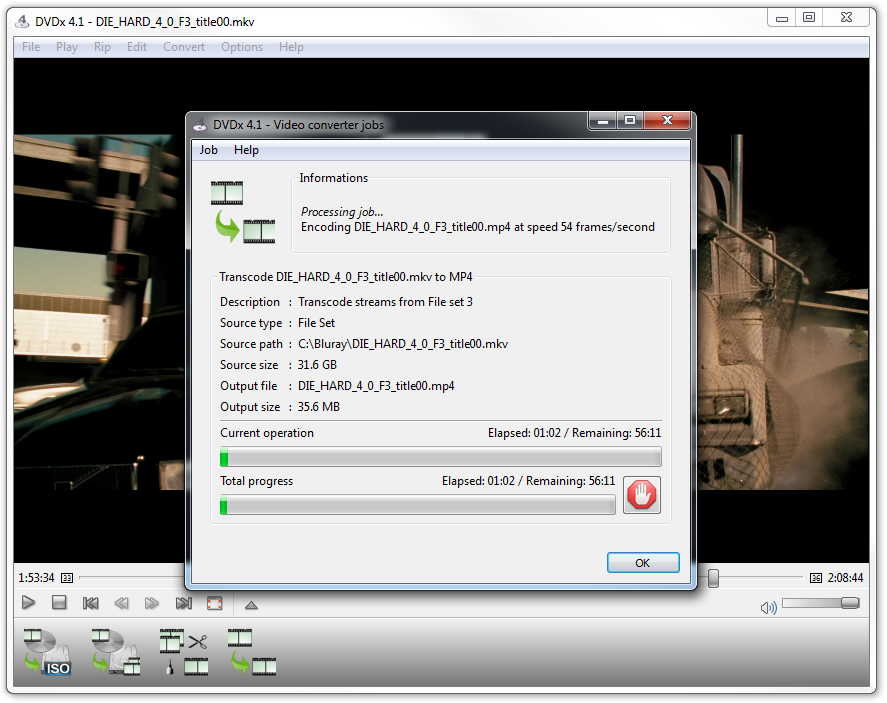
DVDx 4.1 decrypt, copy and transcode DVD and Blu-ray discs at reasonable price ($49).
 The powerful transcoder is FREE to transcode files. The powerful transcoder is FREE to transcode files.
The decrypter requires activation (registered users) while the transcoder is free.
- Rip 3D Blu-ray discs to 3D MKV files and 2D
- Rip Blu-ray and DVD discs to ISO image files
- Rich transcoder features:
- burn subtitles into video stream
- support multi-angle disc titles
- deinterlace video
- remove letterbox
- convert audio, video and subtitles files
- Copy DVD and Blu-ray titles which aren't by other sofware (see FAQ)
|
| |
|
| |
|
| DVDx 4 ranked 4.5/5 by users and editor's pick at filecluster |
 |
|
We create and distribute multimedia software.
Founded by digital video pioneers, labDV has been successful in providing information, help and software for digital video enthusiasts since 2002. In the early 2010, empowered by 10-year experience in digital video, labDV crew has decided to change its purpose and become a software-editor company.